A day in the life of a data analyst
The best part of the job is watching a single number change someone's mind. Getting there takes sharp questions, clean data, and dashboards the whole company comes to rely on. Here's what a real day looks like.
The best part of a data analyst's day is the moment a question nobody could answer becomes a clear number that changes what a team does next. Getting there takes good questions, clean data, and dashboards the whole company comes to rely on, and that mix is exactly what makes the job so satisfying.
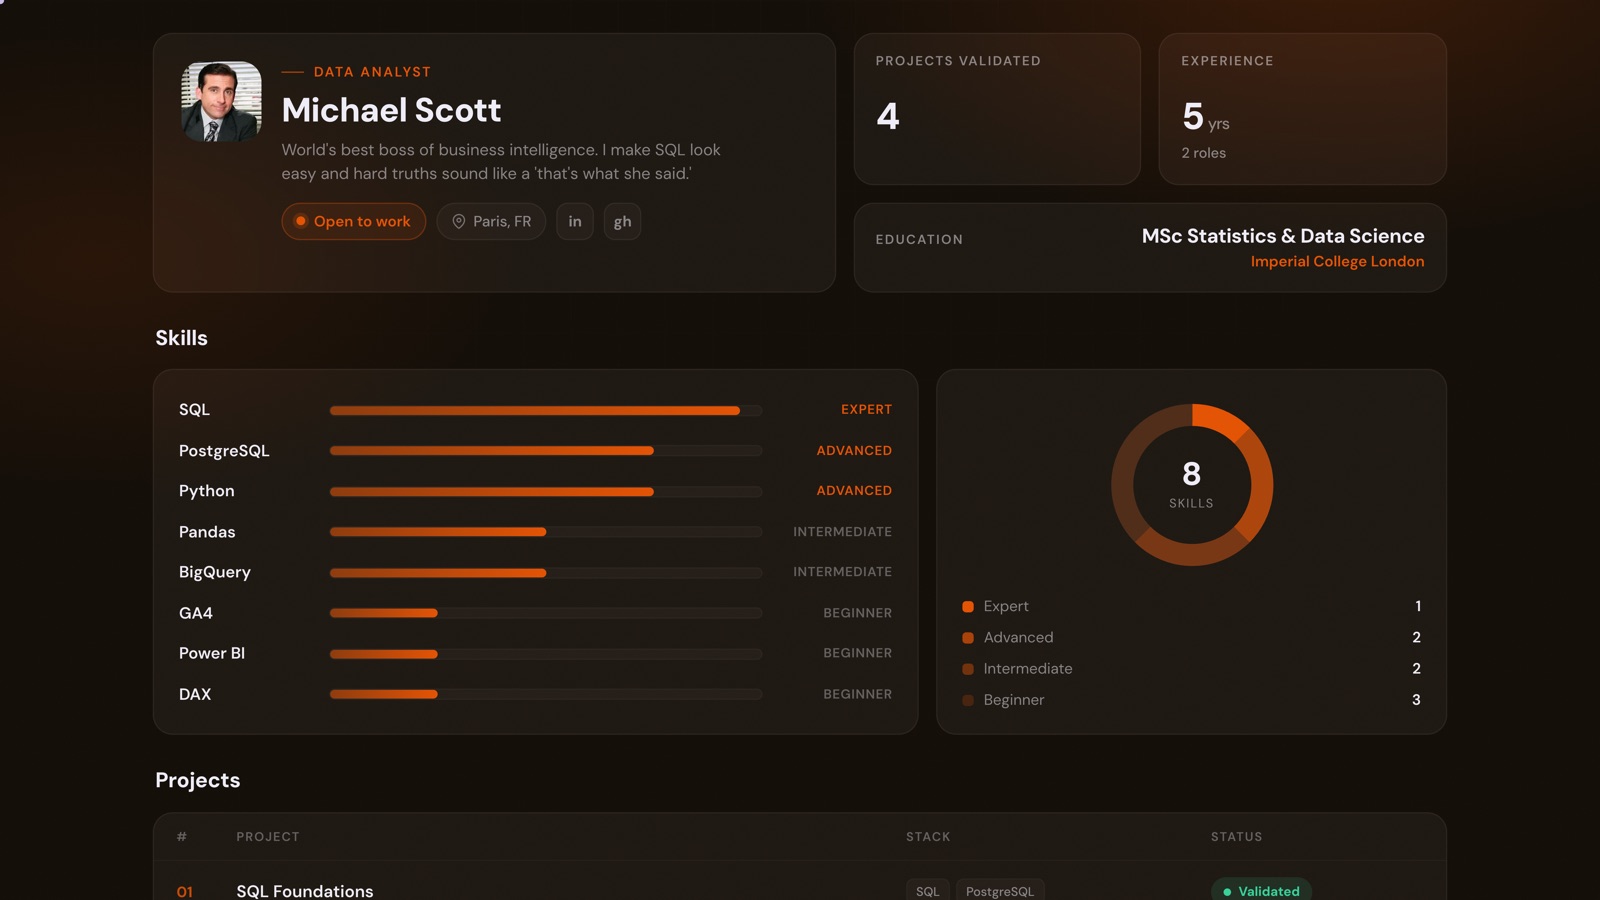
To keep this concrete, we'll follow one analyst through his day: Michael Scott. The day is a composite, but Michael is real enough to click on. His D8A portfolio is public, and every project he points to at the end is validated work you can open and inspect.
Turns business questions into SQL, and SQL into dashboards the whole company actually opens.
“World's best boss of business intelligence. I make SQL look easy and hard truths sound like a 'that's what she said.'”
Open Michael's portfolio →What does a data analyst actually do all day?
Ask ten analysts what they do and you will get ten different answers, but the shape is consistent: people have questions, the data has answers, and the craft is turning the messy gap between them into something people can trust. The core activity is always the same: turning a vague business question into a precise one the data can actually answer.
Some days that means a five-minute SQL pull that unblocks a decision on the spot. Other days it means the satisfying detective work of finding why two reports disagree by 3%. Here is what a typical day looks like.
The DA day at a glance
A typical day, with Michael
Michael is a mid-level analyst on a business intelligence team at a mid-sized company. The timestamps don't matter; the rhythm does.
- 8:45
Did the data land overnight?
Before anything else, Michael checks that the overnight refresh actually ran. A dashboard built on stale data is worse than no dashboard: people trust it and act on it. Two minutes here saves an embarrassing afternoon.
- 9:00
The inbox of 'quick questions'
Slack is already full of "quick questions," which are never quick. Michael triages: what's a one-line SQL answer, what needs real analysis, and what is actually someone asking him to make a decision for them. The last category gets a conversation, not a query.
- 9:30
Ad-hoc pulls and the 3% mystery
A stakeholder swears two reports disagree. Michael writes the SQL, finds the join that double-counts refunds, and fixes it. Unglamorous detective work, but this is most of the job: the answer is usually a definition nobody agreed on, not a bug.
- 10:30
Fifteen minutes, standing up
The team syncs on what's blocked and what shipped. Michael flags that the marketing dashboard needs a new metric, and that he'll need an hour of someone's time to agree on what "active user" means before he can build it.
- 11:00
Where do the good signups come from?
The real work of the day: marketing wants to know which channels bring users who stick around, not just users who click. Michael pulls web analytics, joins it to retention, and segments by cohort. The answer is more interesting than anyone expected, and it points marketing somewhere new.
- 12:30
Lunch (away from the laptop)
Analysis is pattern-matching, and tired brains see patterns that aren't there. Michael, who genuinely believes he is the world's best boss, uses lunch to hold court. The break is still a break.
- 13:30
Updating the dashboard everyone watches
Back to the company dashboard. Michael adds the new metric, but spends most of the time on the boring parts: clear labels, sensible defaults, a tooltip that explains the caveat so nobody misreads it in a board meeting. A dashboard is a product, and its users are non-technical.
- 15:00
Presenting the channel findings
Michael walks marketing through the results. The temptation is to dress up a flat number; the value is in delivering the hard truth clearly and without drama. He lands it with one chart, one sentence, and a recommendation. No forty-slide deck.
- 16:00
Documenting definitions nobody wrote down
The 3% mystery from this morning happened because "revenue" meant two things. Michael writes the definition down where the next person will find it. The analyst who documents is the one people stop second-guessing.
- 17:00
Tomorrow's queue
A quick pass over open questions: what's answered, what's blocked on a definition, what needs a proper analysis rather than a quick pull. Michael ends the day with a clear queue, not seventeen half-written queries.
The skill isn't writing the query. It's knowing which question is actually worth answering, and being honest about what the number really says.
From the day to the portfolio
Here's the catch: an analyst's best work usually lives in a Slack reply or an internal dashboard nobody outside the company ever sees. So how do you show it? You build artifacts. Every thread of Michael's day maps onto a concrete, validated project on his portfolio:
SQL Foundations
The morning ad-hoc pulls and the 3% mystery, where most questions get answered with a well-aimed query.
Python for Analysis
The cohort and retention work that outgrows a spreadsheet the moment it gets interesting.
BigQuery + GA4
The "where do the good signups come from" question, answered against real web analytics at scale.
Power BI Dashboard
The company dashboard from 13:30, built as a product non-technical people can actually trust.
This is the difference between saying you can do the work and showing it. Michael's day is a story; his portfolio is the proof.
What a DA uses every day
The tools vary by company, but the categories are consistent.
SQL
The core tool. Most questions are answered here first.
Python / pandas
When the analysis outgrows SQL: cohorts, stats, automation.
BigQuery / Snowflake
The warehouse where the company's data actually lives.
Power BI / Tableau
Dashboards and reports for non-technical stakeholders.
GA4 / web analytics
data: where users come from and what they do.
Excel / Sheets
Still everywhere. Fast for small, one-off questions.
dbt (light)
Defining metrics once so reports stop disagreeing.
Git
Versioning queries and dashboards like real work.
Slack / Teams
Where the questions arrive and the answers land.
The good and the hard parts of the job
- You answer real questions and see decisions change because of your work
- A broad surface area: you touch every team's data and problems
- SQL and a clear chart will take you a very long way
- Fast feedback: you can go from question to answer in an afternoon
- The most transferable starting point into the whole data field
- Demand is everywhere, in almost every industry and company size
- A fair amount of cleaning and reconciling comes before the fun part
- People want a simple number; the honest answer is often 'it depends'
- You're often asked to confirm a conclusion someone already reached
- Dashboards are never finished; there's always one more request
- Two reports disagreeing by 3% can eat an entire day
- Easy to become a query vending machine if you don't push back
Who thrives as a data analyst
The DA role suits people who are curious, comfortable with messy data, and energized by answering real questions rather than chasing theoretical perfection. You don't need a maths degree. You do need a stubborn respect for what the data actually says, even when it's inconvenient.
If you're the person who, shown a surprising chart, immediately asks "wait, how is that even measured?" then you might already be thinking like an analyst.
The underrated advantage: domain knowledge from a previous career transfers directly. An analyst who used to work in retail reads sales data with instincts you can't teach, and companies pay for that context.
Explore all data careers at D8A Academy
Whether you are exploring a career change or just trying to understand which role fits you, D8A has a guided, project-based track for each of the four data paths: Data Analyst, Data Scientist, Data Engineer, and Business Analyst. The fastest way to find out whether a role is right for you is to build something in it.


