A day in the life of a data scientist
One of the most intellectually rewarding roles in data: you take a vague, open-ended problem and turn it into a model that genuinely changes what a product does. Here's what the day actually looks like.
Data science is one of the most intellectually rewarding roles in the field: you take a vague, open-ended question and turn it into something a model can actually answer. Yes, a lot of the day is shaping messy data and testing ideas that don't pan out, but that's the craft, and the payoff is a model that genuinely changes a decision.
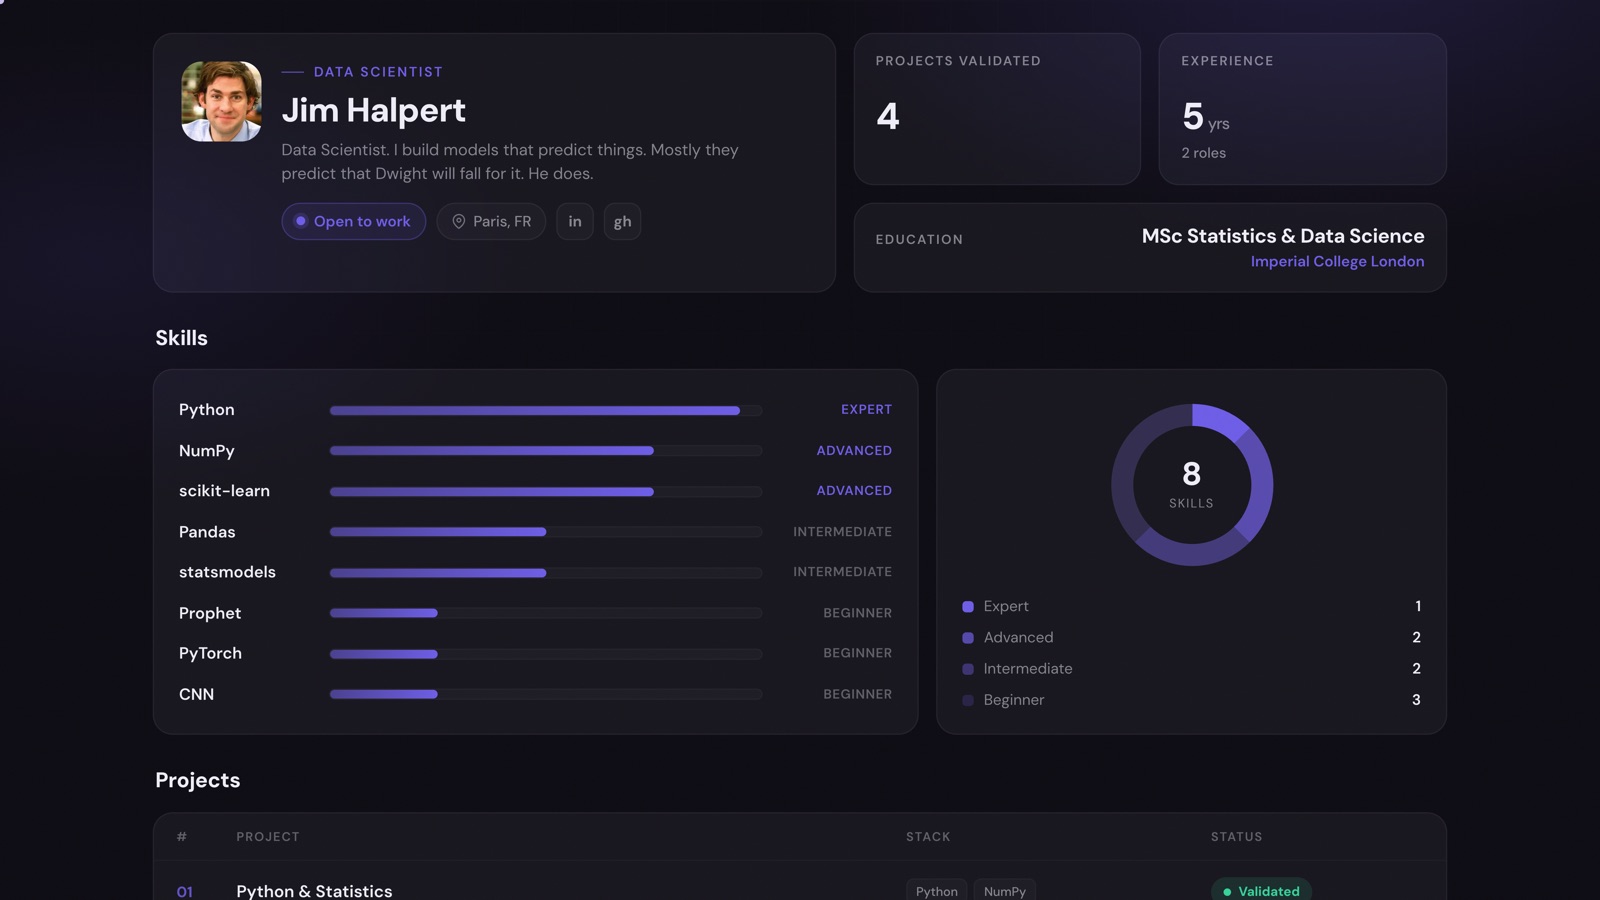
To keep this concrete, we'll follow one scientist through his day: Jim Halpert. The day is a composite, but Jim is real enough to click on. His D8A portfolio is public, and every project he points to at the end is validated work you can open and inspect.
Frames messy problems as models, ships the ones that beat the baseline, and quietly kills the ones that don't.
“Data Scientist. I build models that predict things. Mostly they predict that Dwight will fall for it. He does.”
Open Jim's portfolio →What does a data scientist actually do all day?
The Hollywood version is someone staring at a neural network as insights cascade down the screen. The real version is more grounded and, honestly, more fun: you take a fuzzy business problem, make it measurable, and find out whether a model can actually move it. The core activity is always the same: turning an open question into something you can test, then letting the evidence decide.
Some days that means training models. Most days it means shaping data, running experiments to see what holds up, and helping a stakeholder turn "just use AI" into a question worth answering. Here is what a typical day looks like.
The DS day at a glance
A typical day, with Jim
Jim is a mid-level data scientist on a product team at a mid-sized company. The timestamps don't matter; the rhythm does.
- 9:00
Overnight training runs and a broken metric
The day starts by checking what finished overnight. One training run crashed at epoch 12, and an evaluation metric looks suspiciously perfect, which usually means a leak, not a breakthrough. Jim notes both and resists the urge to celebrate the suspicious one.
- 9:30
Turning a wish into a problem
A product manager wants "a model that knows which users will churn." Jim's first job is to make that measurable: churn defined how, predicted how far ahead, and useful for what action? A prediction nobody can act on is a science project, not a feature.
- 10:15
The unglamorous 60%
Pulling the data, joining tables, handling the 40% of nulls, and discovering that a key field changed meaning last March. This is the bulk of the job and nobody puts it in a job ad. Jim treats it as the actual work, because the model is only as honest as the data under it.
- 12:00
Lunch (and a prank)
Jim takes a real break. He may also have replaced a colleague's plots with a single cursed pie chart. Deadpan, no comment, back to work. The break protects the focus the afternoon needs.
- 13:00
Train the model, beat the baseline
Now the part people imagine. Jim trains a first model, then checks it against a deliberately dumb baseline: "predict the most common outcome." Half the value of the day is knowing whether the fancy model actually earns its complexity. Often it barely does, and that's a finding, not a failure.
- 14:30
Where does it fail, and who does it fail?
A good accuracy number hides bad behavior. Jim slices performance by segment, looks at the worst errors, and checks whether the model fails hardest on the users who matter most. The interesting answers live in the failures, not the headline metric.
- 15:30
The idea that doesn't pan out
Jim tries a richer feature set he was excited about. It adds 0.2% and triples the complexity. He shelves it without ceremony. Killing your own good-sounding idea on the evidence is the skill that separates a scientist from an enthusiast.
- 16:15
Explaining uncertainty to humans
Jim writes up the result for non-technical stakeholders: what the model can do, what it can't, and how confident anyone should be. No jargon, no false certainty. The honest version is less impressive and far more useful.
- 17:00
Reproducibility and tomorrow's run
Last thing: make sure today's result can be reproduced tomorrow, not just remembered. Jim commits the notebook, pins the data version, and queues the next experiment. A result you can't rerun isn't a result.
The magic isn't the fancy model. It's taking a question nobody knew how to answer and turning it into something a team can confidently act on.
From the day to the portfolio
Here's the catch: a lot of a scientist's best thinking is invisible, and plenty of experiments are dead ends by design. So how do you show it? You build artifacts. Every thread of Jim's day maps onto a concrete, validated project on his portfolio:
Python & Statistics
The framing and data-wrangling work, where a fuzzy ask becomes a measurable problem with honest exploratory analysis.
Supervised Learning
The churn model from the afternoon, trained, evaluated against a baseline, and stress-tested by segment.
Time Series Forecast
The kind of forward-looking question a product team actually wants: not "what happened" but "what's next."
Deep Learning
The harder problem worth a heavier tool, prototyped end to end so the trade-off is real, not theoretical.
This is the difference between saying you can do the work and showing it. Jim's day is a story; his portfolio is the proof.
What a DS uses every day
The tools vary by company, but the categories are consistent.
Python
The lingua franca: data, modeling, and everything around it.
pandas / NumPy
The 60% of the job: pulling, joining, and shaping data.
scikit-learn
Baselines and classic models, the workhorse of most projects.
PyTorch / TensorFlow
Deep learning when the problem genuinely needs it.
Jupyter
Where exploration and experiments actually happen.
SQL
Before any model, you still have to get the data out.
statsmodels / SciPy
Hypothesis tests, statistics, and honest uncertainty.
MLflow / W&B
Tracking experiments so results are reproducible.
Git
Versioning code and notebooks like real engineering.
The good and the hard parts of the job
- You work on open-ended problems where the answer isn't known upfront
- The intellectual range: statistics, code, and the business all at once
- A good model can change a product, not just a report
- You're paid to be rigorous and to follow the evidence
- Strong overlap with research; you never stop learning
- High demand and a high ceiling for compensation and impact
- A lot of the day is shaping data before the modeling begins
- Plenty of experiments are dead ends, and that's part of the method
- Stakeholders want certainty; the honest answer is a probability
- 'Just use AI' is a constant pressure with no real spec behind it
- Getting a model into production is often harder than building it
- Easy to over-engineer when a boring baseline would do the job
Who thrives as a data scientist
The DS role suits people who are comfortable with uncertainty, genuinely curious, and more attached to being right than to being impressive. You need real comfort with maths and code, but the rarer trait is intellectual honesty: the willingness to kill your own idea the moment the evidence turns against it.
If you're the person who, handed a too-good-to-be-true result, immediately tries to break it rather than ship it, then you might already be thinking like a data scientist.
The underrated advantage: domain knowledge makes your models honest. A scientist who understands the business knows which features make sense and which "signals" are just leakage, and that judgment is hard to teach.
Explore all data careers at D8A Academy
Whether you are exploring a career change or just trying to understand which role fits you, D8A has a guided, project-based track for each of the four data paths: Data Analyst, Data Scientist, Data Engineer, and Business Analyst. The fastest way to find out whether a role is right for you is to build something in it.