Learn together · Build your portfolio · Meet recruiters

Your journey into data.

Guided projects on real data. A portfolio that builds itself as you finish them. Recruiters who hire for data, one click away. And a community, so you never do it alone.

d8a.academy/dashboard
01 Learning path02 Portfolio03 Recruiters
Data Analyst
4 of 9 validated
✓SQL Foundations
✓Retail Churn Analysis
✓Sales Dashboard
✓A/B Test Readout
5Marketing Attribution
6Forecasting Basics
Step 3 of 7 · in progress
Marketing Attribution
Multi-touch attribution across five channels on 48k orders. Build the model, then defend the numbers.
SQLPythondbt
-- step 3 · which channel actually converts?
select channel, count(*) as conversions
from touchpoints group by channel
✓ Query check passed, +22 points
Data Analyst

Michael Scott

Data Analyst, former paper salesman. I know what a sales team actually needs from a dashboard, because I used to be the one ignoring it. I make SQL look easy and hard truths sound like a 'that's what she said.'
Open to workParis, FRingh
Projects
5
Experience
9yrs
3 roles
Education
Data Analyst path
D8A Academy

Skills

SQL
Expert
Excel
Expert
BigQuery
Advanced
Python
Advanced
Pandas
Advanced
Power BI
Advanced
DAX
Intermediate
Looker
Intermediate
GA4
Intermediate
dbt
Beginner
10
skills
Expert2
Advanced4
Intermediate3
Beginner1

Projects

#ProjectStackStatus
01E-commerce sales analysis in SQLAnswered twelve business questions on an e-commerce database with JOINs, CTEs and window functions: revenue by month and category, repeat-purchase rate, average time between first and second order. Ranked customers by lifetime value and found that 9% of them made 41% of the revenue.
SQLPostgreSQL
02Customer churn exploration in PythonCleaned a subscription dataset with Pandas (missing values, inconsistent plan names, duplicated accounts), then explored who cancels and when. The main finding: most cancellations happen in the first 60 days, and customers who never used the mobile app churned at twice the rate. Charted with Matplotlib.
PythonPandas
03GA4 funnel and retention in BigQueryRebuilt the purchase funnel from raw GA4 event data exported to BigQuery: sessions, product views, add to cart, checkout, purchase. Measured the drop at each step by device and built weekly retention cohorts. Mobile checkout lost 2.5x more users than desktop at the payment step.
BigQueryGA4
04Executive KPI dashboard in Power BIPower BI model with a sales fact table and date, product and store dimensions. DAX measures for revenue, margin, year-over-year growth and the share of revenue per channel. One executive page, one page per region, with bookmarks for the monthly review.
Power BIDAX
05Vélib' station demand in ParisPulled a year of Paris bike-share station data from the open data portal, loaded it into PostgreSQL and looked at which stations run empty, and when. Morning commute empties the residential stations in the east by 8:30. Wrote it up as a short blog post with maps.
PythonPandasSQL
Personal

Experience & education

20142016201920212024Now
Data Analyst · ManoManoWork2024 — Present

Analyst for the French marketplace category team. I own the weekly performance report (BigQuery + Looker), run ad-hoc analyses for six category managers, and built the seller-churn alert that flags sellers whose sales drop 30% month over month.

Junior Data Analyst · Fnac DartyWork2022 — 2024

Built and maintained the e-commerce team's Power BI reports (traffic, conversion, revenue by channel). Automated the daily sales extract with Python, which saved the team about two hours a day of manual Excel work.

Data Analyst path · D8A AcademyEducation2022

Four validated projects: SQL, Python for analysis, BigQuery and GA4, Power BI.

Sales Representative · Dunder MifflinWork2017 — 2022

Regional paper and office supplies sales. Consistently in the top three of the branch. Learned the business before learning the data, which is still the most useful thing on this page.

BSc Business Administration · Université Paris NanterreEducation2014 - 2017

Skill coverage

BigQueryDAXGA4PandasPostgreSQLPower BIPythonSQL
E-commerce sales analysis in SQL
Customer churn exploration in Python
GA4 funnel and retention in BigQuery
Executive KPI dashboard in Power BI
Vélib' station demand in Paris
Filled cell = skill used in that project.
01 Learning path02 Portfolio03 Recruiters
Recruiters · data rolesrecently hiring
Any countryIn-houseAgencyNot contacted yet
SL
Sofia Lindqvist
Talent partner · Northwind Data · Sweden
Hires for Data Analyst, Analytics Engineer
✓connected
TA
Thomas Aubert
Data recruiter · Kestrel Search · France · agency
Hires for Data Engineer, Data Architect
✓contacted
PN
Priya Nair
Head of analytics · Brightfold · UK
Hires for Junior Data Analyst, Product Analyst
Notecopied
Your outreach
9recruiters contacted, 4 connected
Directory
People who hire for data
members
Checked by hand
Added every week
growing
Connection note
Links your portfolio
1 click
Recent roles
What they posted lately
30 days
  • 04 career paths
  • 40+ guided projects
  • 01 live portfolio link
  • 1k+ students on Discord

First things first,
join us on Discord.

D8A Academy is a community that connects data students and data professionals. We are here to help each other: share tips and insights, review each other’s portfolios and projects, and find people to learn with, so you stay motivated and never end up doing this alone.

Join us on Discord1k+ members · free to join

Three steps,
one continuous line.

Nothing here is a separate product. What you learn becomes what you show, and what you show is what gets you the interview.

01

Learn data.

No video to sit through. Every path is an ordered sequence of guided projects on real datasets, checked at each step. If the query does not run, you have not learned it yet.

  • In-browser SQL playground free
  • Step-by-step verification 40+ projects
  • You always know the next step nothing to pick
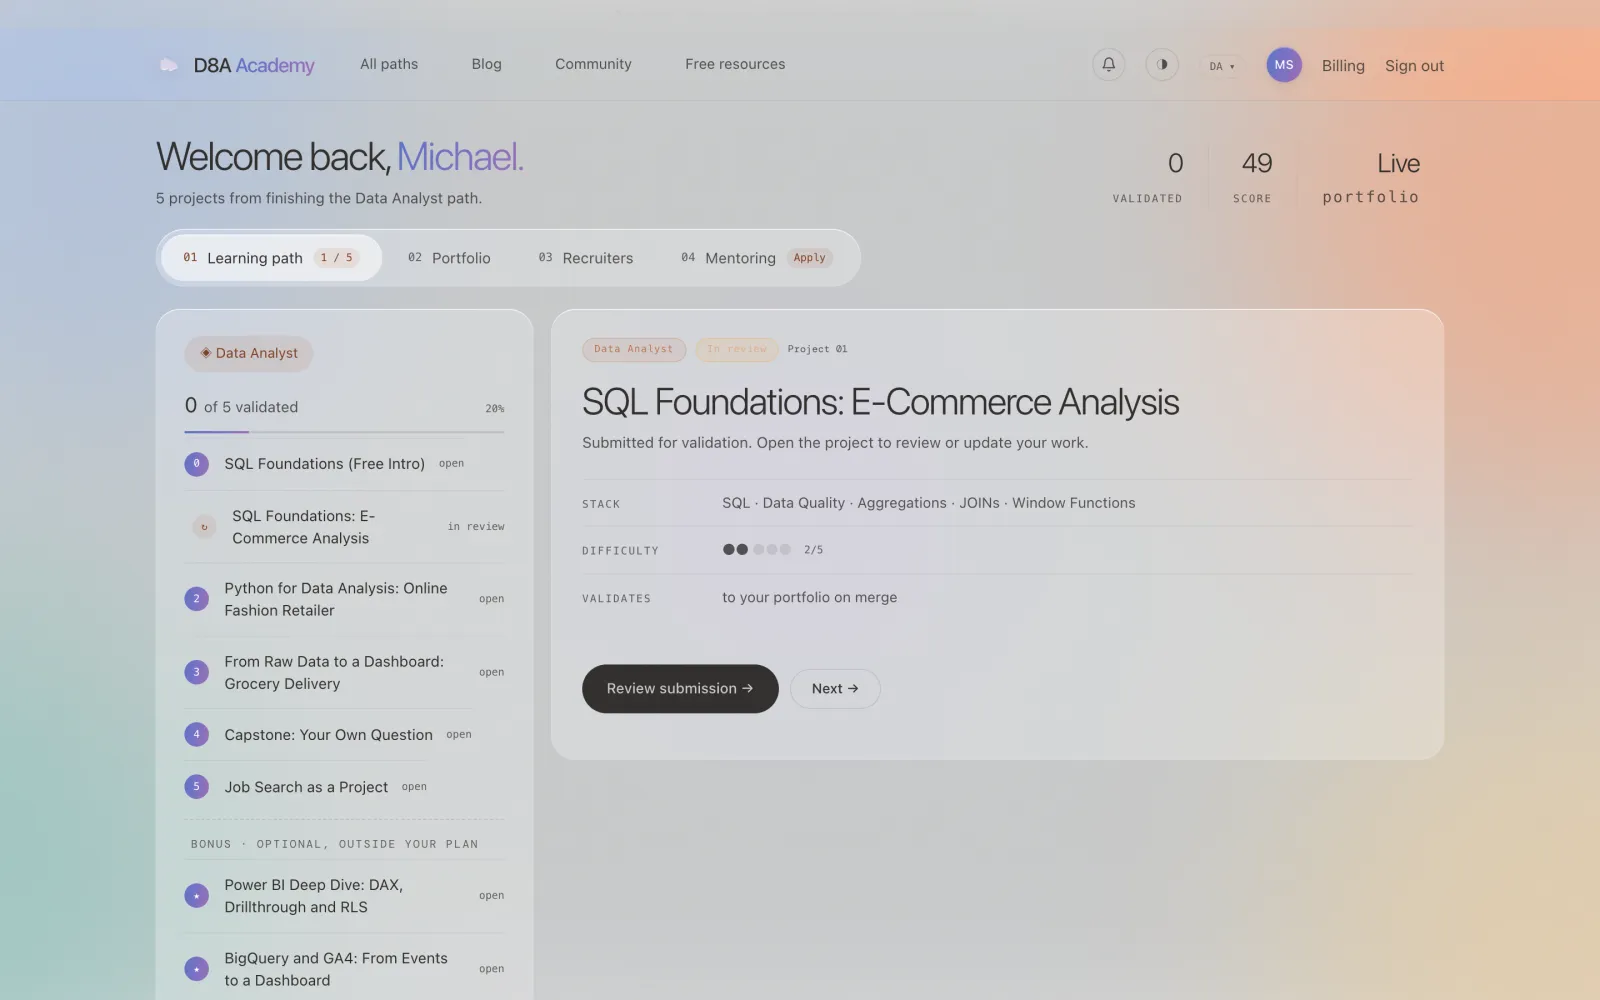
How learning works →
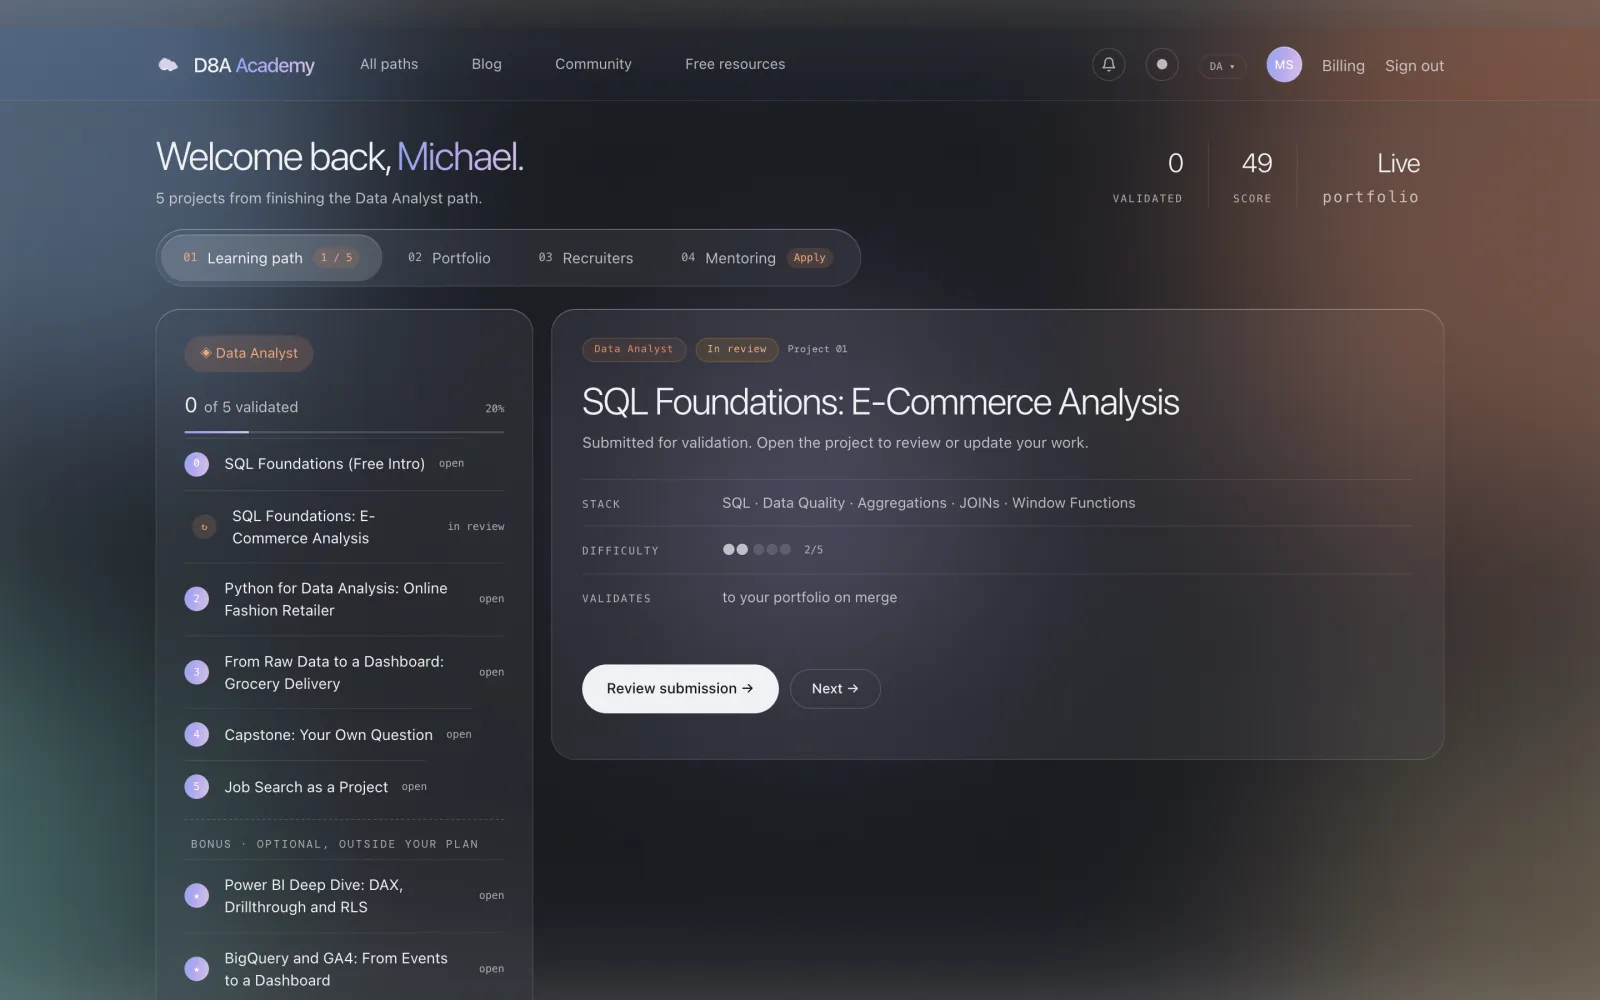
The learning path tab of the dashboardThe learning path tab of the dashboard
02

Build your portfolio.

Every project you finish lands on your live portfolio page automatically, with your score, your stack and your proof of work. Add your own projects alongside them. One link for your CV and your LinkedIn.

  • A live page, not a PDF always current
  • Structural portfolio score 0–100
  • Your own projects too not just ours
See what a portfolio looks like →
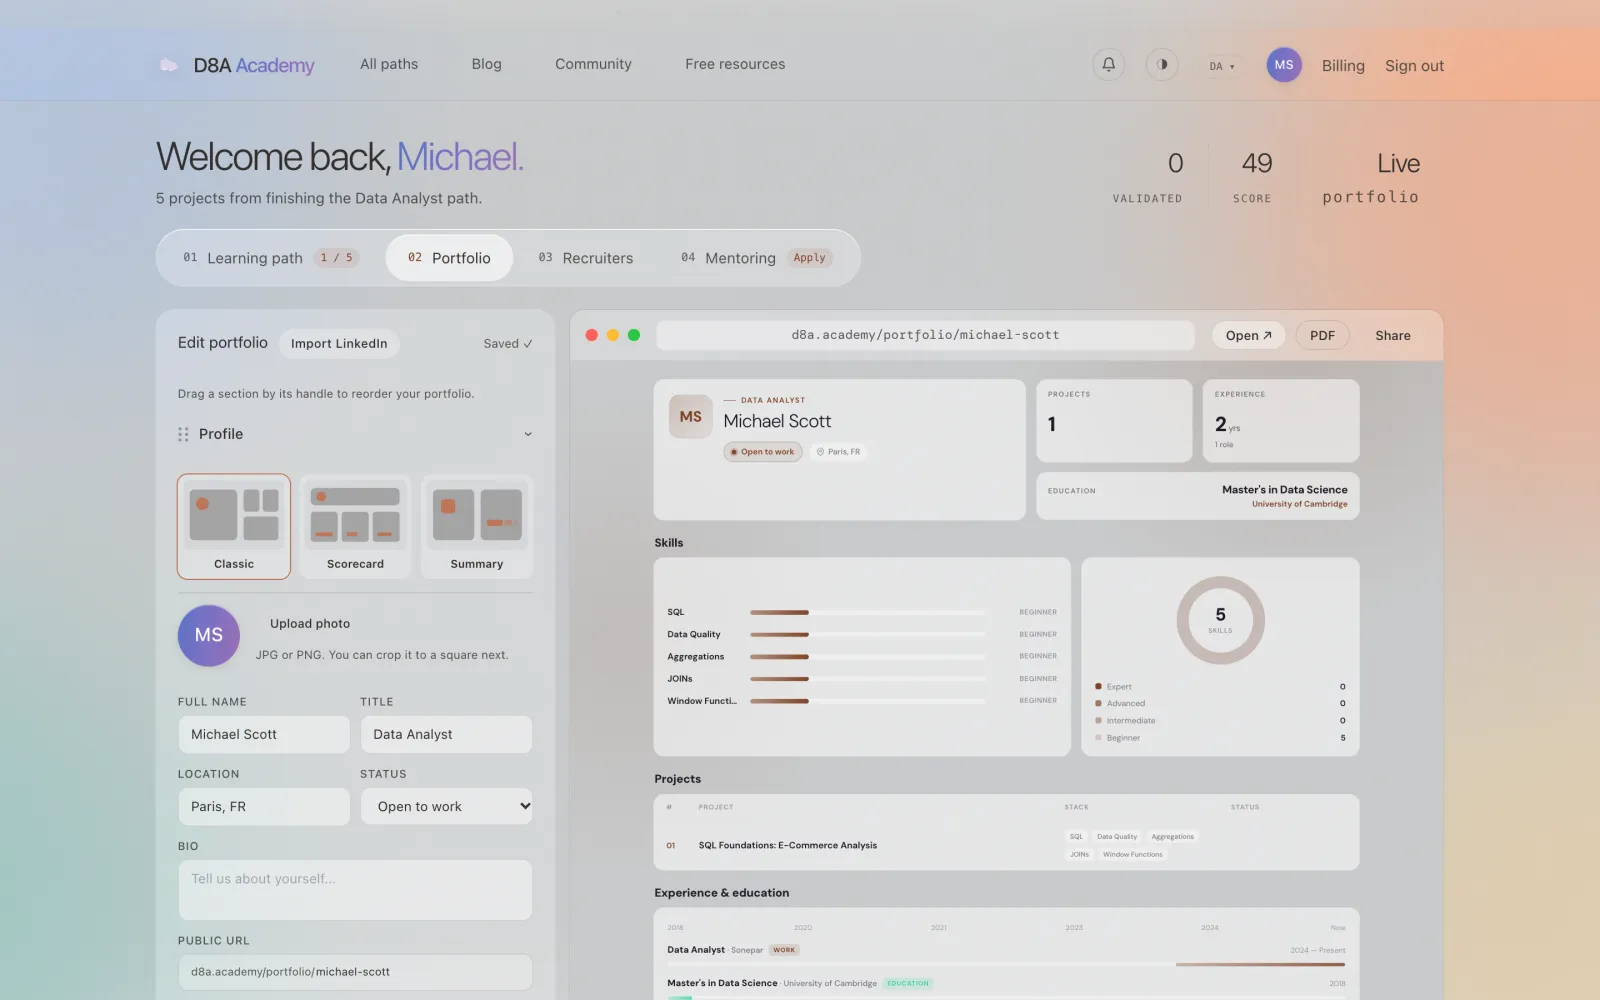
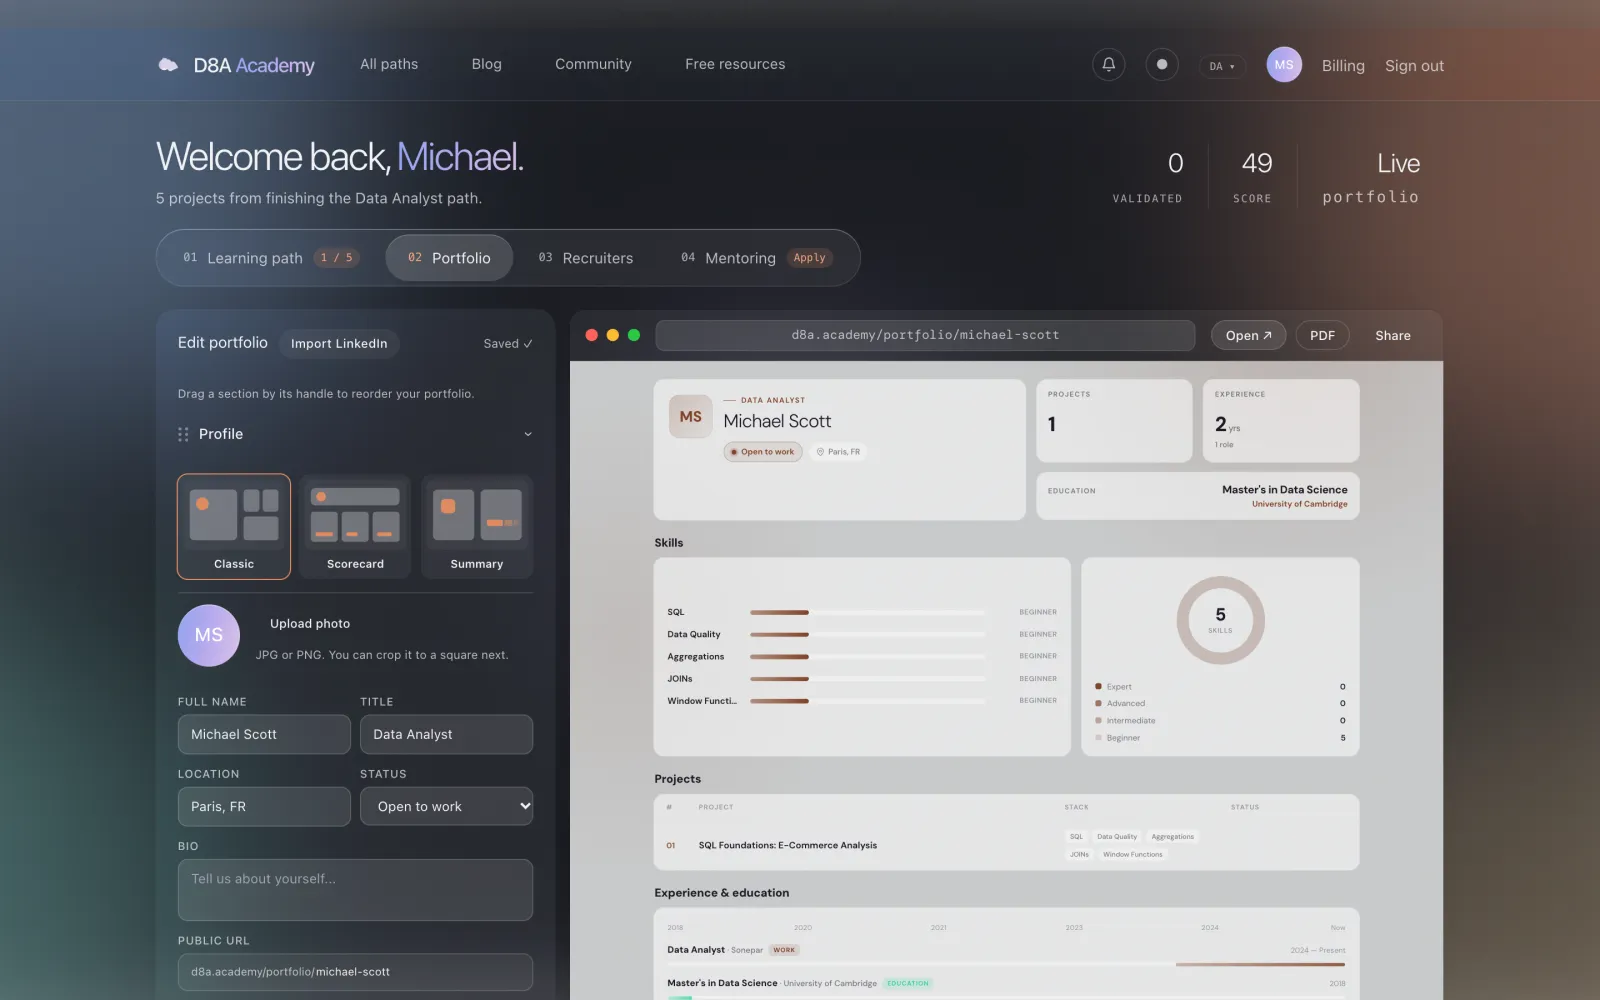
The portfolio editor in the dashboard, with the live previewThe portfolio editor in the dashboard, with the live preview
03

Meet the recruiters.

A members-only directory of the people who hire for data roles, checked by hand and growing every week. See where each of them hires and what they recruit for, copy a connection note that links your portfolio, and tick off who you contacted. Build your network while you build your portfolio, so the people hiring already know your name when you apply.

  • People who hire for data roles checked by hand
  • A connection note with your portfolio link ready to send
  • Tick off who you contacted and who accepted your tracker
  • In-house and agency, junior to senior every level
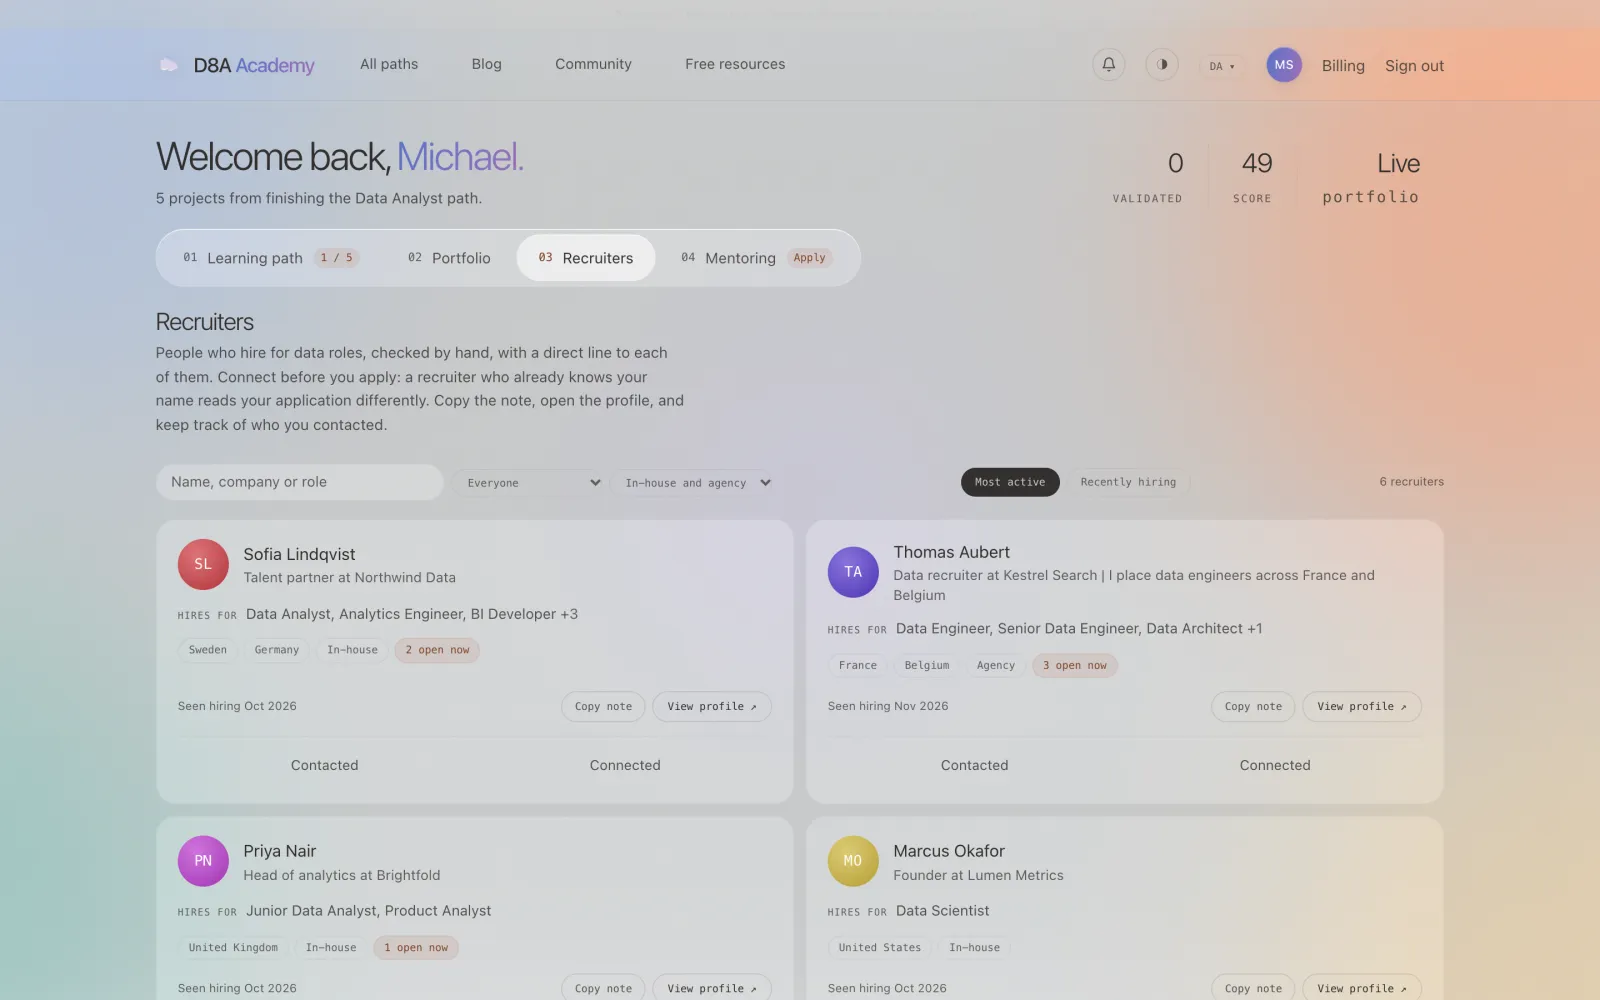
See what members get →
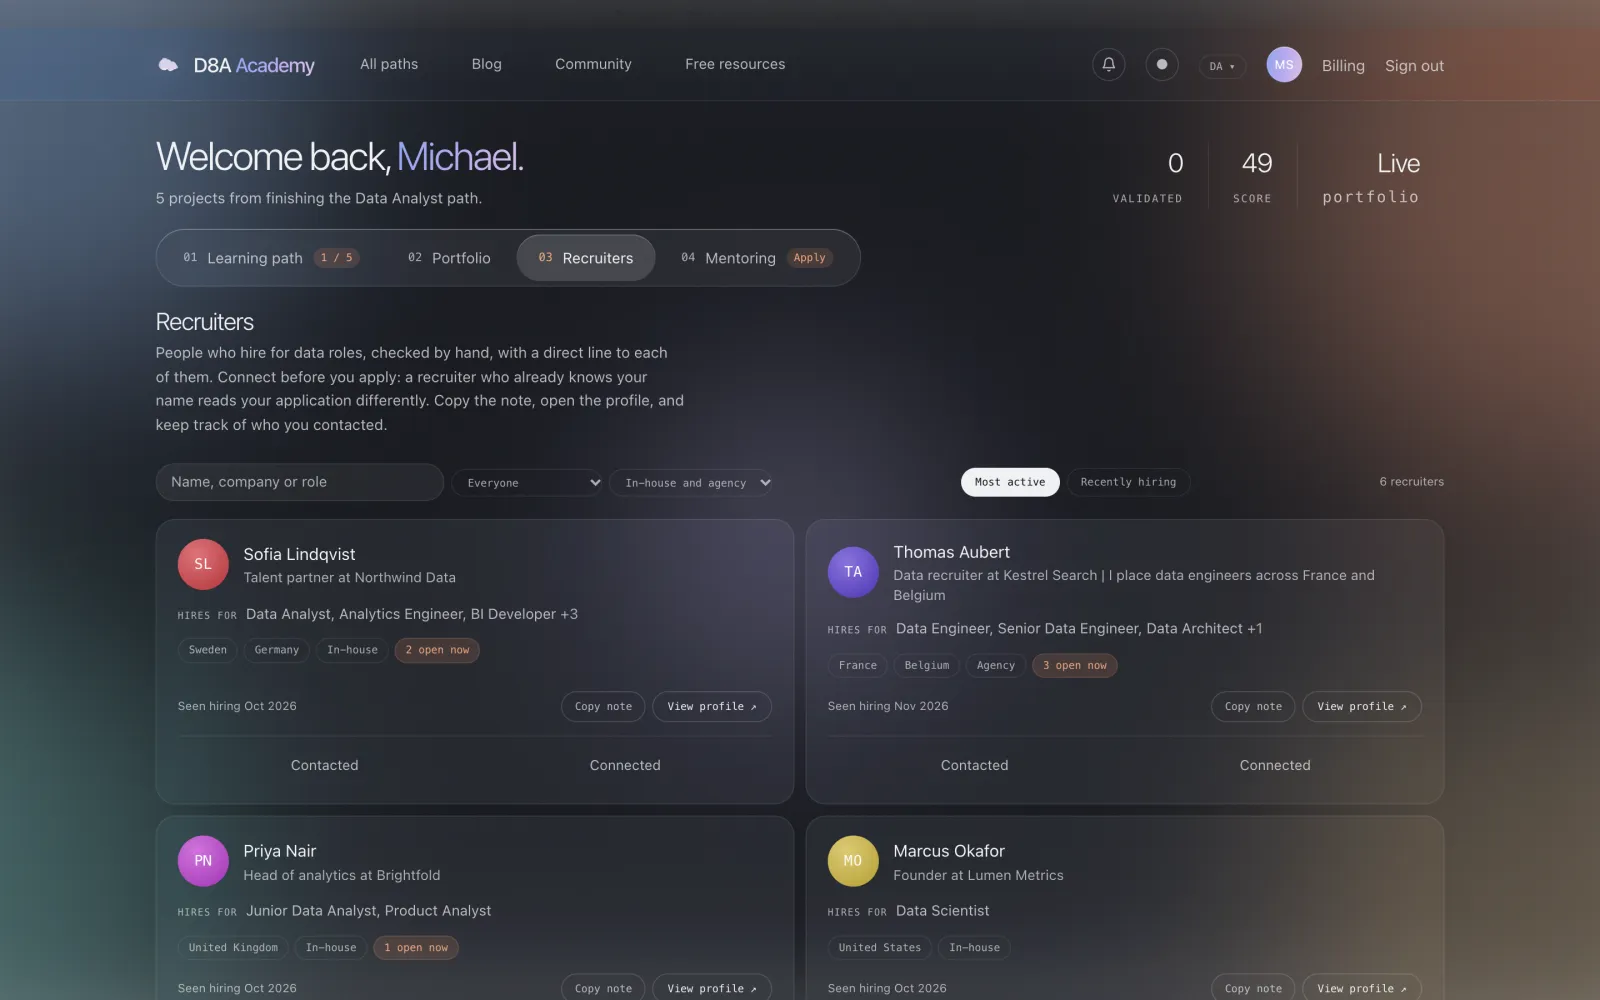
The Recruiters tab of the dashboardThe Recruiters tab of the dashboard

Start free.
Upgrade for more.

The foundations course, your first project and a live portfolio page cost nothing. No card. Members also get the recruiter directory: the people who are hiring, one click from a connection request.

Free
$0
  • Foundations course + first project
  • Live portfolio page
  • Weekly challenge + leaderboard
  • Discord community
  • Recruiter directory locked
  • Full paths locked
Start free
Academy Pass
$15 /month
  • All 4 paths, 40+ projects
  • Project checks + portfolio score
  • Recruiter directory: connect with people who hire
  • Connection notes + outreach tracker
  • Discord community + your monthly cohort
  • Cancel anytime
Get the Pass
Academy Pass · Yearly
$89 / year
  • All 4 paths, 40+ projects
  • About $7.40 a month, one payment
  • Project checks + portfolio score
  • Recruiter directory: connect with people who hire
  • Connection notes + outreach tracker
  • Discord community + your monthly cohort
Get the year
Students

What students say.

Learn data
“I started on Coursera, but what I really wanted was projects that go straight into a portfolio. This is exactly that. I have learned a lot more by shipping than I ever did watching lectures.”
Kyle B. · Data Analyst student
Build your portfolio
“I used to send a CV and hear nothing. Now I send my portfolio link and recruiters actually respond to it. The feedback is a completely different level than with my CV alone.”
Jordan P. · D8A student
Find a job
“The daily alert changed how I apply. Offers land in my inbox the day they are posted on LinkedIn, I apply while they are still fresh, and the interviews have started coming in.”
Megan L. · D8A student

Questions.

What exactly is free?
The foundations course with its in-browser SQL playground, your first guided project, a live portfolio page and the weekly challenge. No card required.
How is this different from a certificate?
A certificate records that you watched something. Your portfolio is a live page of validated, scored projects a recruiter can open and inspect.
I am starting from zero. Is that a problem?
No. Each path starts from nothing and the free intro takes two minutes to try. If you are unsure which path suits you, the quiz will place you.

Your journey into data,
starting today.